Technology Assessment
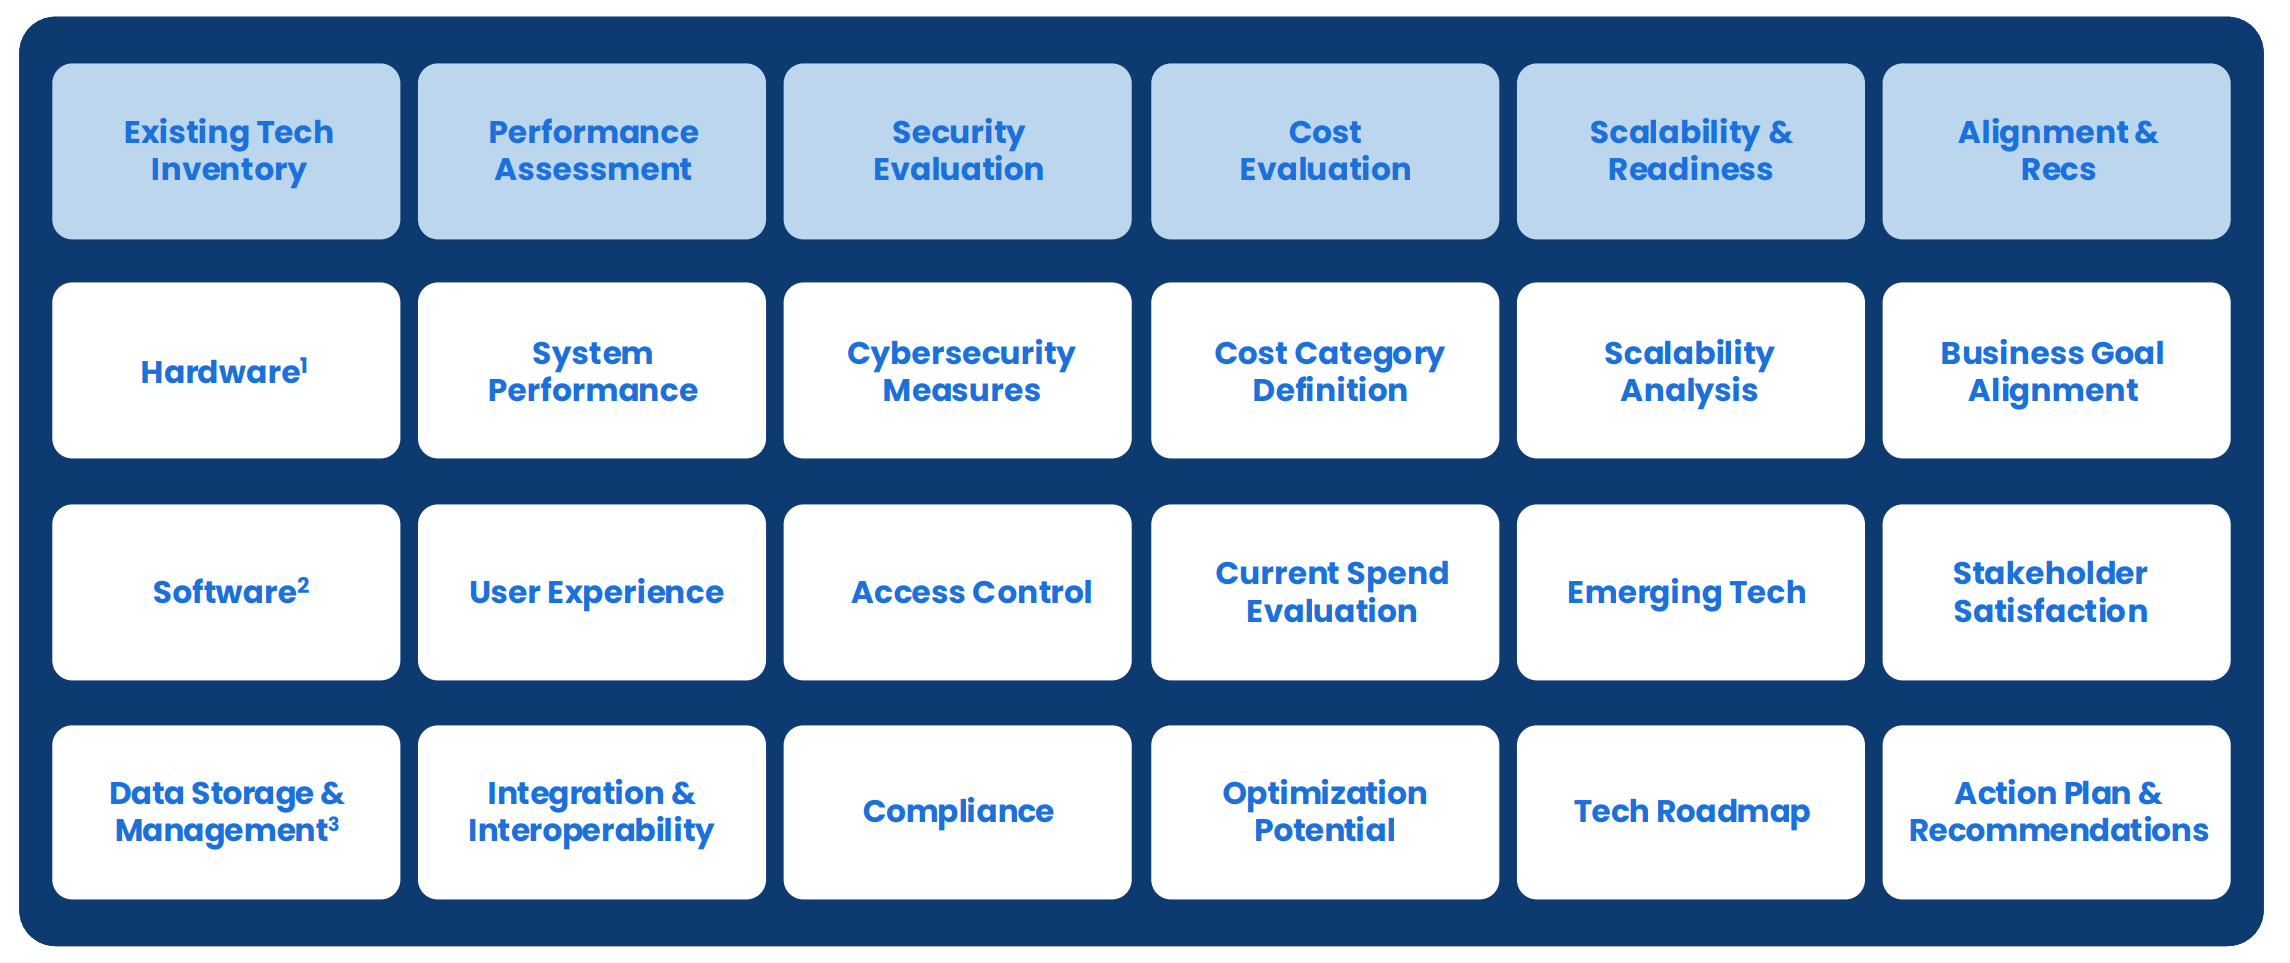
A flowchart with six rows and five columns, each cell containing blue text on a light blue or white background. The flowchart titles include categories such as 'Existing Tech Inventory,' 'Performance Assessment,' 'Security Evaluation,' 'Cost Evaluation,' 'Scalability & Readiness,' and 'Alignment & Recs.' Subcategories within the cells include technical and strategic elements like 'Hardware,' 'System Performance,' 'Cybersecurity Measures,' 'Cost Category Definition,' 'Stakeholder Satisfaction,' and others.

Note:

1. Optimization potential is 15-20%
2. Optimization potential of 5-10%
3. Optimization potential of 15-25%

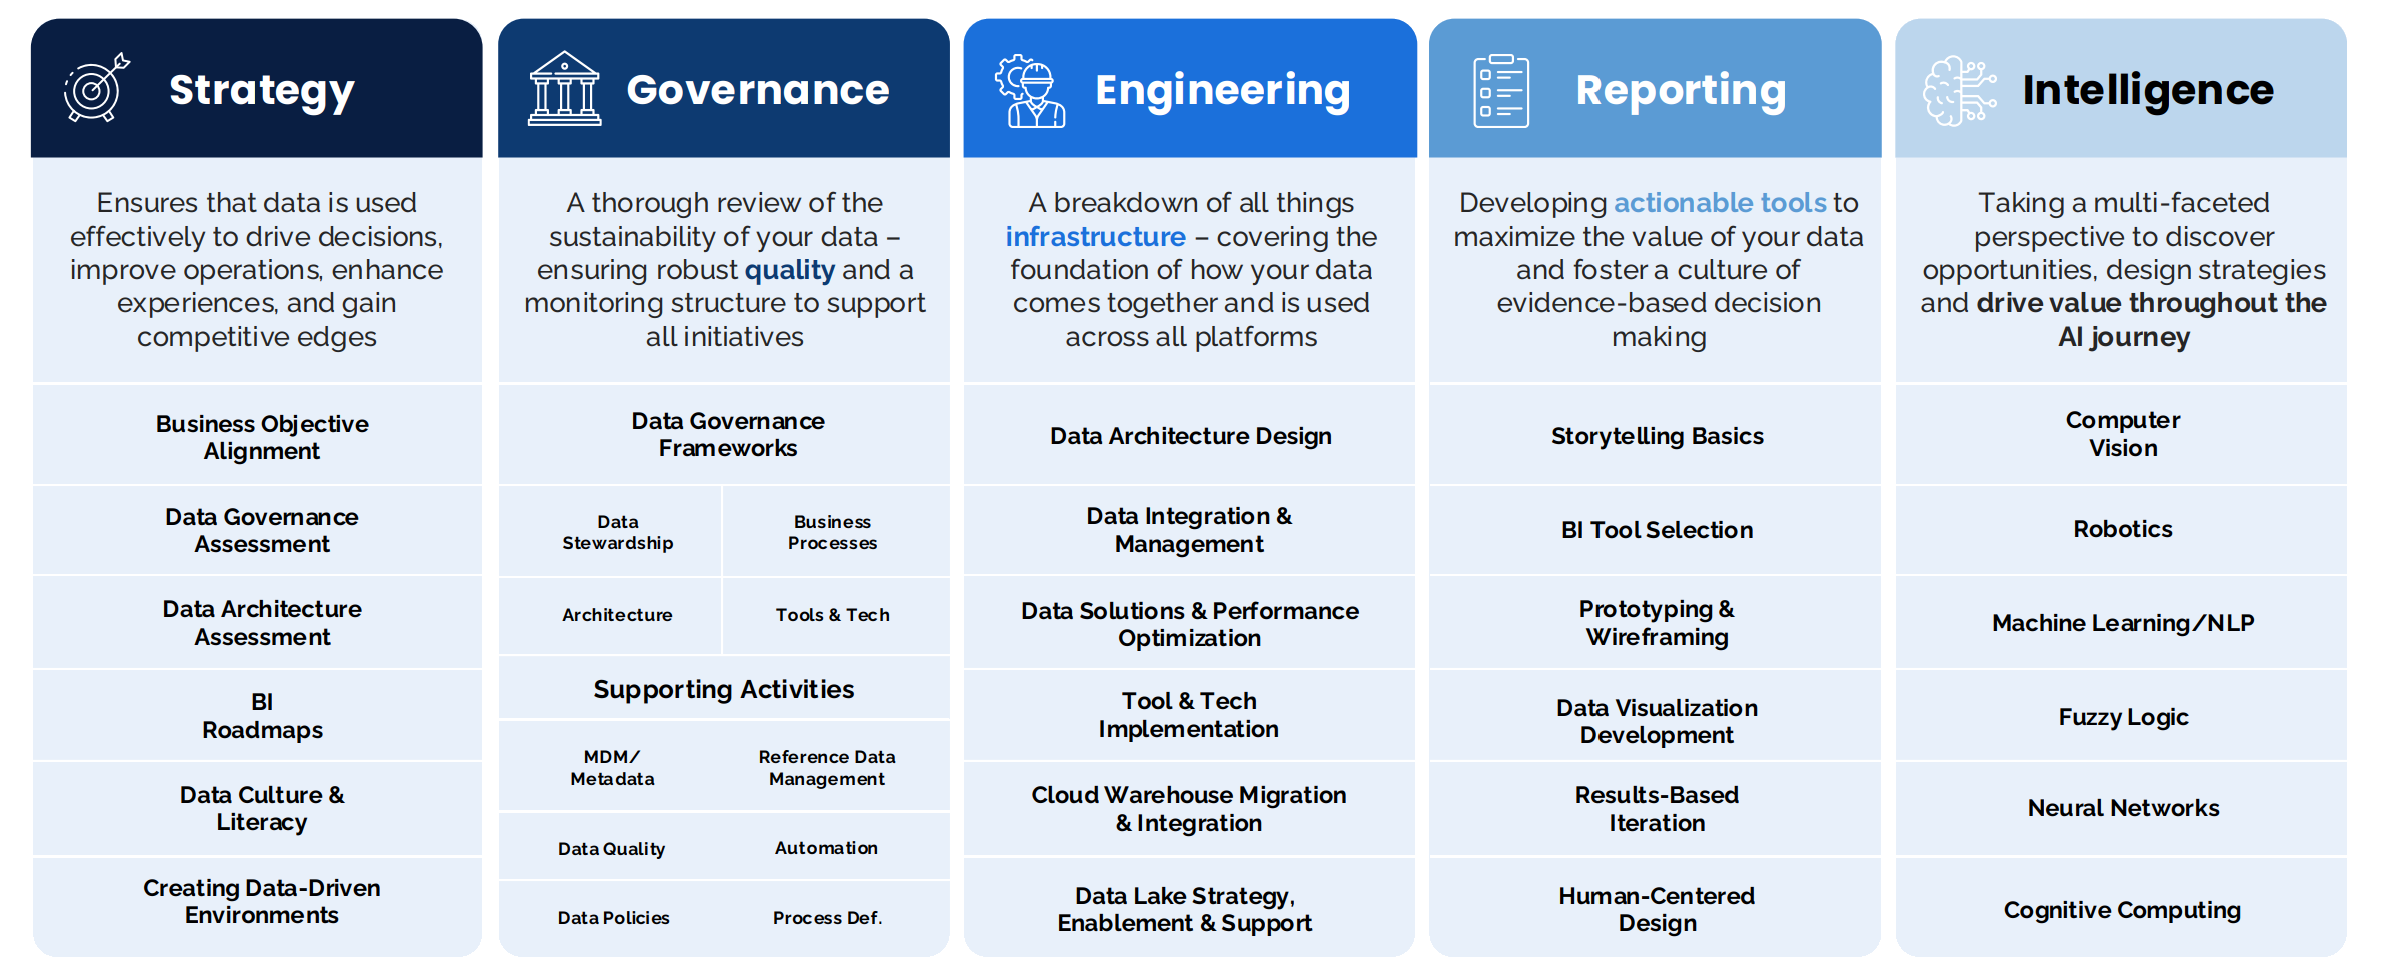
We focus on establishing an end-to-end understanding of the data lifecycle

A detailed infographic presenting five pillars of data-driven methodology: Strategy, Governance, Engineering, Reporting, and Intelligence, with descriptions and key activities for each.